
View the latest statistics: HMRC R&D tax relief statistics for 2024
This year has changed everything – and HMRC’s annual R&D stats release can’t help but resemble a relic from the distant past. Interesting to look at, sure, but ultimately an anachronism in our pandemic era.
ForrestBrown has no problem reading the tea leaves and extracting the key points nestled in the data. But what used to be a worthwhile endeavour is increasingly at odds with the enormous challenges before us.
68295 businesses funded through R&D tax credits in 2018-2019
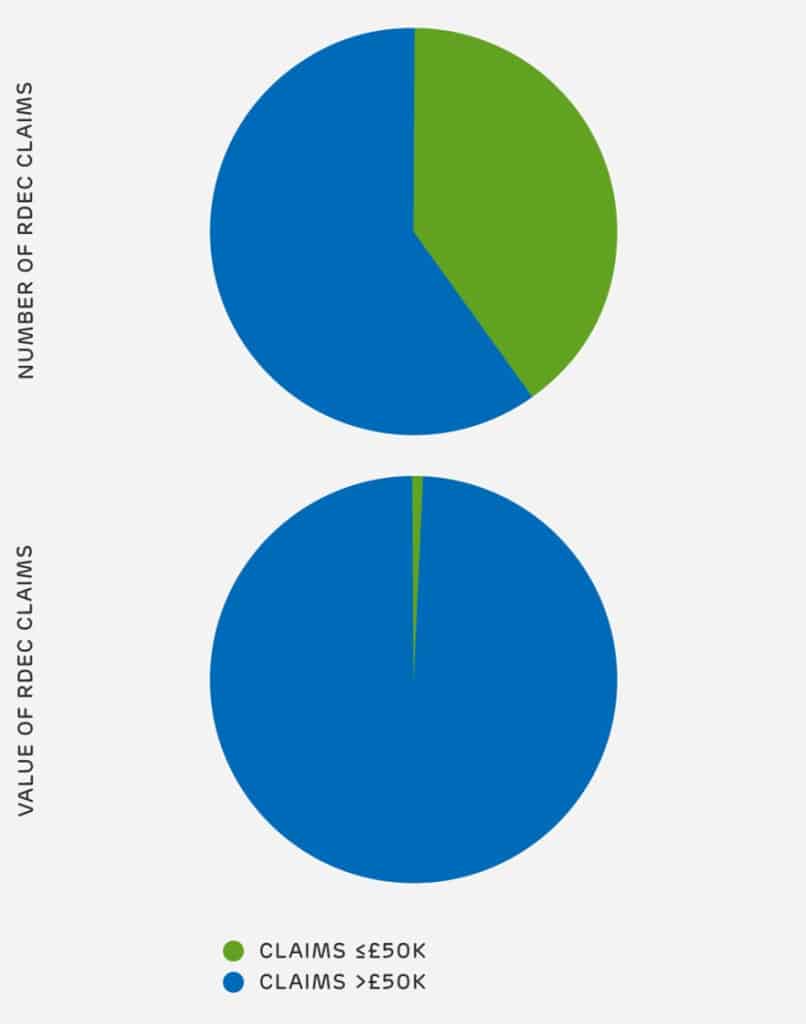
41% of large company RDEC claims are worth less than £50k
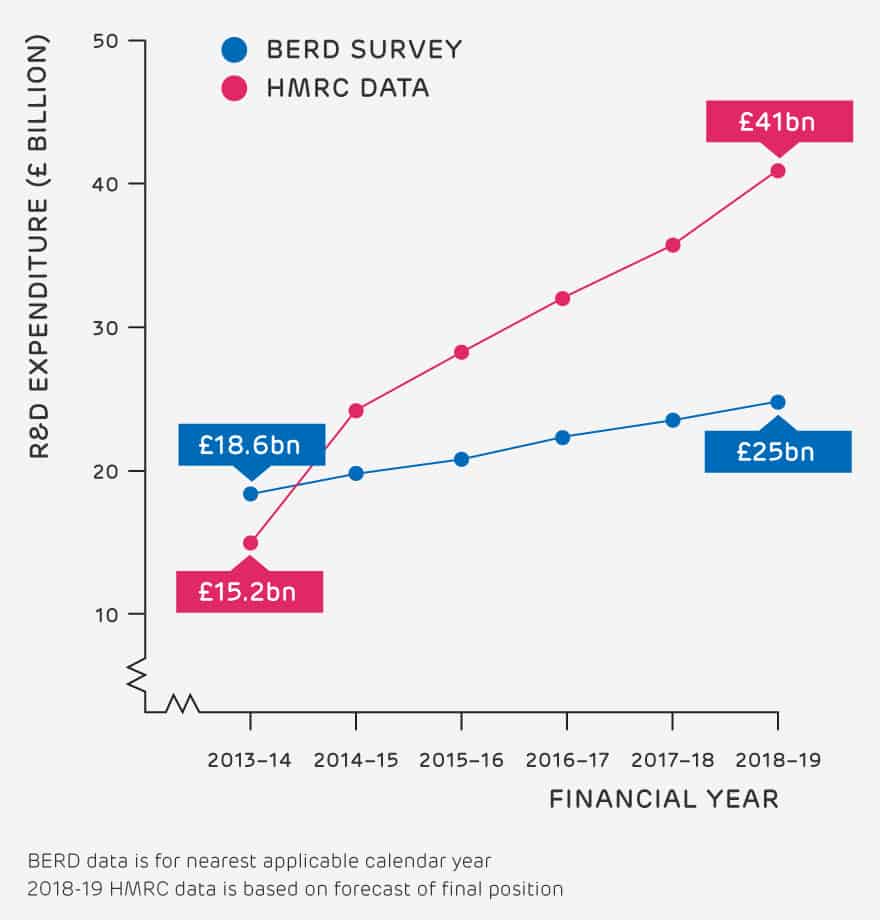
64% disparity in R&D spend between HMRC stats and ONS data
Key R&D tax credit trends
Too often in the pre-COVID era, we have seen government decision-making beset by inertia and red-tape. But crises force us to act quickly and decisively. The response to COVID-19 proves that the government can act decisively with data-driven, brave and efficient policy-making.
As the UK begins the long climb back from recession, we need to ensure our businesses (and the communities they serve) are supported. R&D will be key in the UK’s recovery, and R&D tax credits are a proven way to spur investment in innovation. HMRC carried out a study in 2015 which showed that for every £1 awarded in tax relief, up to £2.35 of additional investment in R&D is stimulated.
ForrestBrown has seen an increased demand for the incentive from companies – but is the government willing to meet this demand with renewed ambition? If so and the government is serious about the role that R&D has to play in the COVID recovery and beyond, then the impact of the incentive must be measurable.
Trend one
HMRC crackdown and bad stats
The amount of R&D expenditure reported by HMRC is substantially more (64%) than that reported by BERD (business enterprise research and development survey). We don’t know the truth about why this is.
Over the last few years, there have been increasing attempts from HMRC to clamp down on what it considers to be spurious claims. There absolutely is a very real and present problem with spurious advisers in the R&D tax advice market, but this data also raises the concern that the clampdown could in part be based on bad stats.
It helps no one if an attack on spurious claims is led by spurious statistics.
Trend two
Large companies, small claims
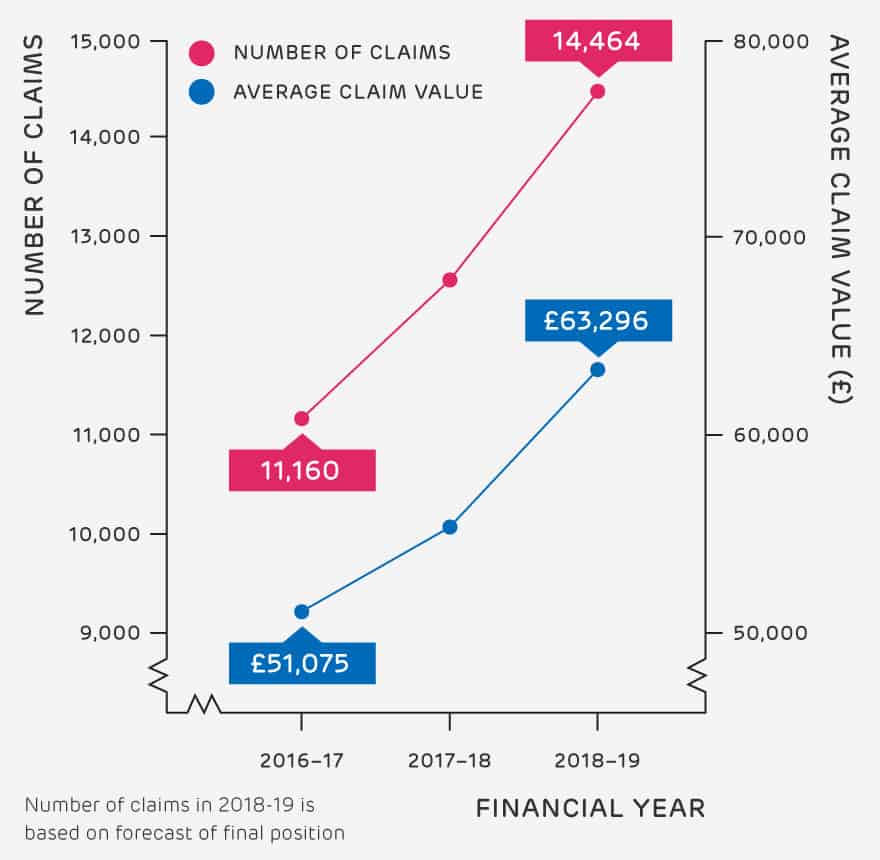
Last year, we reported that nearly three-quarters of SMEs claimed less than £50k, a trend repeated in this year’s data. We now also see a similar trend emerge for large companies, 41% of whom also make small-value claims.
This might not look like news, but these are large businesses, each with over 500 staff members and a substantially higher cost base. These companies recognise they are innovating, but only report a small fraction of their costs in their R&D claims.
Big businesses often struggle to realise the full potential of their R&D, as they lack engagement across key stakeholders in the business. R&D claims are often the remit of the finance team, but engagement from technical department leads and senior leadership is essential to a fully maximised RDEC claim.
Trend three
Yet more SMEs claim RDEC
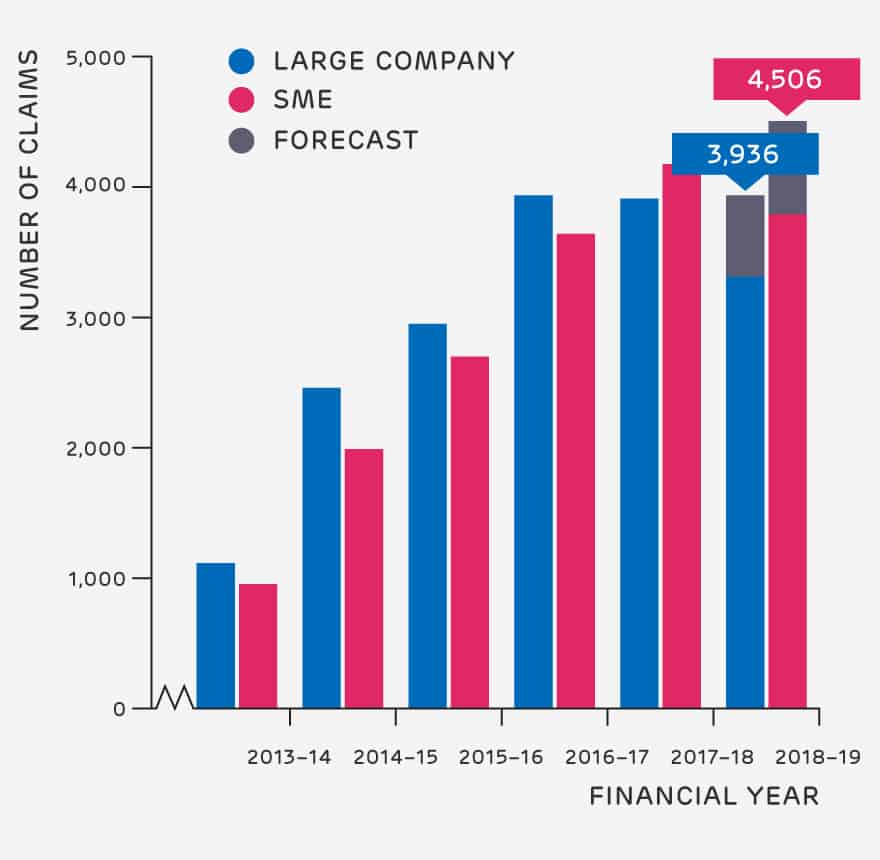
Overall, we have seen another increase in the number of SMEs claiming RDEC. This happens for all sorts of reasons (EU State Aid rules, for example). But the increasing use of RDEC shouldn’t simply be waved away as a legal quirk.
Before the introduction of RDEC in 2013, these SMEs had access to the old large company scheme, but most chose not to claim, primarily because it didn’t offer the cash benefit that RDEC does.
RDEC was introduced to increase visibility, certainty and generosity for loss-making businesses. All of these characteristics make it as attractive to SMEs as to larger businesses.
Having seen the impact of both, it is clear that RDEC is the superior mechanism when compared to the SME incentive and should be the basis for all claims. Businesses using RDEC, whether loss- or profit-making, can be much more sure about the size of the benefit they will receive.
It’s increasingly clear that maintaining two wildly different mechanisms for relief simply doesn’t make sense, especially for the growing number of SMEs who access both incentives.
Trend four
Small claims cast long shadow
Over the last few years, we’ve seen more businesses than ever make use of R&D tax credits. ForrestBrown is proud to have played a key role in raising awareness of the incentive and educating businesses on how to claim.
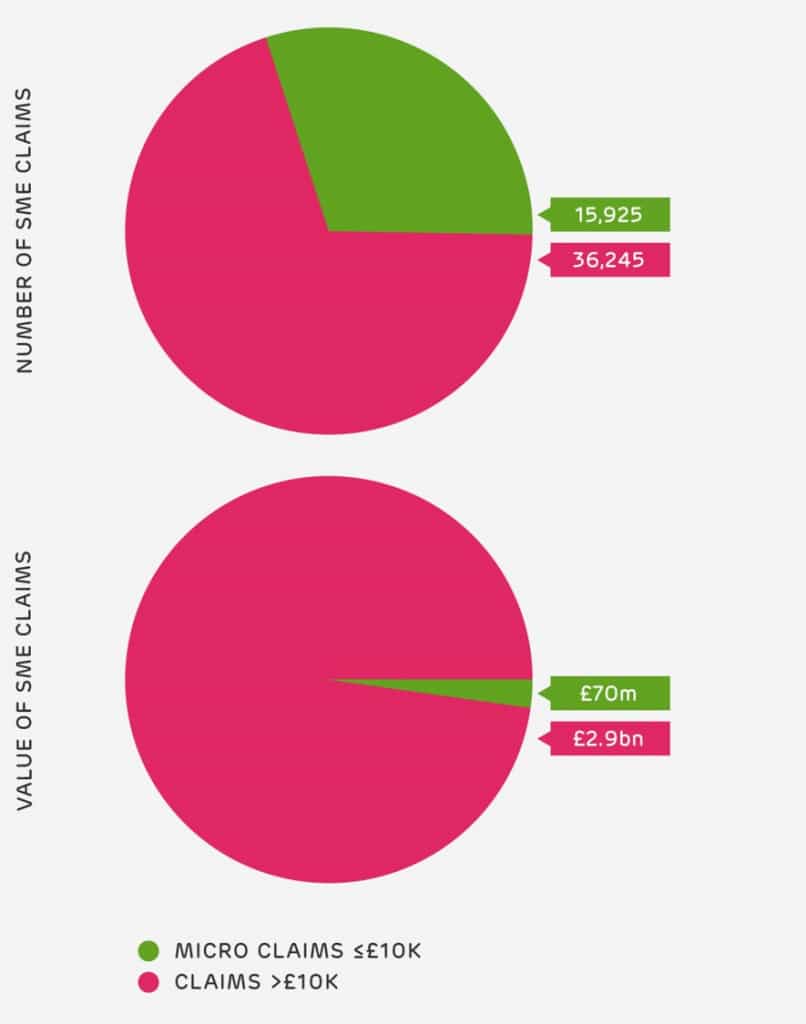
The 15,925 micro (that is, sub-£10k) claims each year could be transformational for the small businesses or start ups claiming them, but this influx has diluted claim values. Almost a third of SMEs claim £10k or less, representing only 2% of the total cost to HMRC. This volume of claims puts a significant administrative burden on HMRC.
R&D tax credits under the SME scheme are increasingly a tale of two brackets: a cluster of smaller claims on the lower end and a burgeoning stratum of bigger claims from larger SMEs, with a predicted 27% increase in claims worth over £50,000.
Trend five
Software and digital takes bigger byte of the R&D pie
As the prominent VC Marc Andreessen observed: “software is eating the world”. There is no modern sector that doesn’t overlap with digital in some way.
As disruptive digital start ups have matured and upset the status quo in every sector, businesses of all types are looking for software and technology solutions for some of their most challenging problems. Those who continue to resist now risk being left behind by their agile peers.
As software becomes more and more ubiquitous, it’s unsurprising that software R&D claim numbers and values continue to grow strongly and consistently for the ICT sector.
Our forecasted figures
HMRC’s 2018-19 data is still partial and will be restated in next year’s statistics release. Rather than wait until next year, we’ve forecasted the likely final figures for this period. HMRC has estimated based on their experience of claim filings, that the total cost of relief claimed will increase from £5.3bn to £6.3bn when the final figures are reported. We’ve used this increase (18.9%) in our analysis.

Facing a specific challenge?
Our best-in-class specialist R&D tax credit advice will help you to make better strategic decisions for your business.
Benchmark my R&D claim
Are you one of the 57,355 businesses already investing in innovation and making an R&D tax credit claim?
If so, you’ll want to check how your R&D tax credit claim stacks up against businesses in your region and your sector for peace of mind that you’re making the most of this valuable source of funding.
Average RDEC claim
Average SME claim value
Benchmark your R&D tax credit claim by region
How does your R&D tax credit claim compare to your peers?
And where are those businesses based? A quick note: Regional allocation is based on the postcode of the company’s registered address, which might not correspond to where R&D takes place.
R&D in the North East
Blessed with shallow seams of coal near the coast, the North East’s past is irrevocably tied to the coal industry. Its future, however, is altogether less soot covered, with an emerging base of engineering and petrochemical expertise.
- 5,610 SMEs
- 300 Large companies
- 280 SMEs in large companies & RDEC
- £230m SMEs
- £75m Large companies
- £25m SMEs in large companies & RDEC
- £40,998 SMEs
- £250,000 Large companies
- £65,789 SMEs in large companies & RDEC
R&D in the North West
Once the beating heart of the textile industry, the North West is now an important hub for construction, financial services and media. Its two biggest cities, Liverpool and Manchester, increasingly capable of challenging London’s primacy.
- 5,455 SMEs
- 295 Large companies
- 350 SMEs in large companies & RDEC
- £245m SMEs
- £100m Large companies
- £15m SMEs in large companies & RDEC
- £44,913 SMEs
- £338,983 Large companies
- £42,857 SMEs in large companies & RDEC
R&D in the Midlands
The Midlands is home to world-class legacy firms, but the region isn’t defined by these giants. It is home to a bustling plane, train and automotive manufacturing and an ever-growing digital entertainment sector.
- 8,220 SMEs
- 480 Large companies
- 560 SMEs in large companies & RDEC
- £350m SMEs
- £350m Large companies
- £35m SMEs in large companies & RDEC
- £42,579 SMEs
- £729,167 Large companies
- £62,500 SMEs in large companies & RDEC
R&D in the East of England
The East of England boasts a proud agricultural heritage. Today, you’re just as likely to find software devs as sheep farmers especially at Cambridge’s hi-tech software, biotechnology and electronics hub, the so-called Silicon Fenn.
- 5,120 SMEs
- 235 Large companies
- 345 SMEs in large companies & RDEC
- £345m SMEs
- £275m Large companies
- £35m SMEs in large companies & RDEC
- £67,383 SMEs
- £1.2m Large companies
- £101,449 SMEs in large companies & RDEC
R&D in London
London’s financial services institutions and disruptive fintech firms lead the Capital’s dynamic economy which also features an unmatched creative media industry and a dynamic construction sector.
- 10,190 SMEs
- 915 Large companies
- 715 SMEs in large companies & RDEC
- £860m SMEs
- £610m Large companies
- £65m SMEs in large companies & RDEC
- £84,396 SMEs
- £666,667 Large companies
- £90,909 SMEs in large companies & RDEC
R&D in the South East
The high-tech companies that have headquartered in the M3 and M4 corridors make the South East one of the UK’s most prosperous regions. Pharma, ICT and space tech contribute to the largest regional economy outside of London.
- 7,805 SMEs
- 565 Large companies
- 605 SMEs in large companies & RDEC
- £500m SMEs
- £460m Large companies
- £45m SMEs in large companies & RDEC
- £64,061 SMEs
- £814,159 Large companies
- £74,380 SMEs in large companies & RDEC
R&D in the South West
Here in the South West, we enjoy something of an innovation microclimate, emanating from a diverse mix of sectors. We have everything from advanced aerospace, manufacturing and marine engineering to meteorology, food, software and semiconductors.
- 4,045 SMEs
- 150 Large companies
- 270 SMEs in large companies & RDEC
- £155m SMEs
- £85m Large companies
- £20m SMEs in large companies & RDEC
- £38,319 SMEs
- £566,667 Large companies
- £74,074 SMEs in large companies & RDEC
R&D in Wales
Wales can count electronics, oil and gas, and aerospace alongside some of the most ambitious renewable energy projects in the world. Though Welsh heavy industrial steel and metal ore refining have declined, they remain an important presence.
- 1,795 SMEs
- 70 Large companies
- 136 SMEs in large companies & RDEC
- £90m SMEs
- £20m Large companies
- £10m SMEs in large companies & RDEC
- £50,139 SMEs
- £285,714 Large companies
- £74,074 SMEs in large companies & RDEC
R&D in Scotland
Although oil and gas continue to play a vital role in Scotland’s economic fortunes, its cities and universities are increasingly home to an array of innovative enterprises in app technologies, software and life sciences.
- 2,405 SMEs
- 215 Large companies
- 310 SMEs in large companies & RDEC
- £135m SMEs
- £85m Large companies
- £15m SMEs in large companies & RDEC
- £56,133 SMEs
- £395,349 Large companies
- £48,387 SMEs in large companies & RDEC
R&D in Northern Ireland
Traditionally an industrial economy with pedigree in shipbuilding, ropemaking and textiles, N.I.’s economy is now a modern service economy. By 2025, the government aims to have a total R&D spend of £1.2bn and 58,000 Knowledge Economy jobs.
- 1,400 SMEs
- 85 Large companies
- 130 SMEs in large companies & RDEC
- £70m SMEs
- £30m Large companies
- £2.5m SMEs in large companies & RDEC
- £50,000 SMEs
- £35,941 Large companies
- £19,154 SMEs in large companies & RDEC
Benchmark your SME R&D tax credit claim by sector
The average SME claim value has risen this year, with many more companies claiming north of £50,000. These SMEs shouldn’t rest on their laurels, however. An expert adviser can ensure every penny possible is claimed.
Agriculture, Forestry, Fishing R&D Claims
Like so many other industries, the inherent tension between increasing yields while being more eco-friendly is driving innovation to new heights. But as with the wider trend, the number of SME claims (555) has increased while the average SME claim value (£45,045) is lower than average and continues to dip, which would seem to indicate value is being left to rot in the fields.
What counts as R&D in this sector?
- Developing or modifying machinery or equipment.
- Experimenting with new renewable energy technology, such as solar, biomass and anaerobic digestion.
- Creating new pesticides, fertilisers, or other chemicals to increase yield.
- 555 Agriculture, Forestry, Fishing R&D Claims
- 52,160 All SME Claims
- £25m Agriculture, Forestry, Fishing R&D Claims
- £3bn Value of all SME claims
- £45,045 Average claim value for Agriculture, Forestry, Fishing
Mining & Quarrying R&D Claims
As an industry dominated by muscular corporate power, SME mining and quarrying is rare. That said, when R&D does happen, an SME R&D tax credit claim can be significant at £90-£100k.
What counts as R&D in this sector?
- Developing a new process for lifting and positioning heavy plant into a structurally fragile site.
- Creating alternative methods to extract harmful materials.
- Creating a software analysis platform for the mining industry.
- 50 Mining & Quarrying R&D Claims
- 52,160 All SME Claims
- £2.5m Mining & Quarrying R&D Claims
- £3bn Value of all SME claims
- £49,800 Average claim value for Mining & Quarrying
Manufacturing R&D Claims
The UK is home to over 100,000 manufacturers, and this bustling sector receives the third highest amount overall in R&D tax credits (£595m). Average claim amounts, however, are slightly less than the overall UK average (£50,021) and with only 11,895 firms claiming (a decrease compared to last year).
What counts as R&D in this sector?
- Tooling and equipment fixture design and development.
- Designing innovative programmable logic controllers.
- Integrating new automation technology to streamline processes.
- 11,895 Manufacturing R&D Claims
- 52,160 All SME Claims
- £595m Manufacturing R&D Claims
- £3bn Value of all SME claims
- £50,021 Average claim value for Manufacturing
Electricity, Gas, Steam & Air Conditioning R&D Claims
With this sector at the forefront of the battle against climate change, its SMEs are innovating and, as a result, they enjoy significant claim values. The average SME claim is up nearly £10k year on year at £95,238. ONS data shows total greenhouse gas emissions have been on a steady decline since the 90s and the disruptive SMEs who use R&D tax credits to fund their innovation can keep that momentum going.
What counts as R&D in this sector?
- Improving or developing alternative heating and cooling systems.
- Developing bespoke ventilation, plumbing and refrigeration systems.
- Retro fitting modern systems into listed period buildings.
- 105 Electricity, Gas, Steam & Air Conditioning R&D Claims
- 52,160 All SME Claims
- £10m Electricity, Gas, Steam & Air Conditioning R&D Claims
- £3bn Value of all SME claims
- £95,238 Average claim value for Electricity, Gas, Steam & Air Conditioning
Water, Sewerage & Waste R&D Claims
A sector none of us could do without, water, waste and sewerage may be important for society, but these industries are middle of the road in terms of R&D intensity. Last year, we noted that the average SME claim in this sector was slightly below the general claim average. This year the gap has widened further (£51,724 average SME claim compared to £57,228 average SME claim).
What counts as R&D in this sector?
- Creating a system for removing solids from water in C/D floatation tanks.
- Developing new methods to control pathogens.
- Implementing novel energy recovery techniques.
- 290 Water, Sewerage & Waste R&D Claims
- 52,160 All SME Claims
- £15m Water, Sewerage & Waste R&D Claims
- £3bn Value of all SME claims
- £51,724 Average claim value for Water, Sewerage & Waste
Construction R&D Claims
Another sector where high R&D intensity doesn’t match with the number of construction firms in the UK. With over a quarter-million construction SMEs in the UK (and even accounting for the large proportion of sole traders), it’s clear many eligible firms still aren’t making use of R&D tax credits (3,055 claims in total and an average claim value of £57,283).
What counts as R&D in this sector?
- Integrating new or improved technology into buildings.
- Modifying existing components and fittings into bespoke projects.
- Developing structures from novel construction materials.
- 3,055 Construction R&D Claims
- 52,160 All SME Claims
- £175m Construction R&D Claims
- £3bn Value of all SME claims
- £57,283 Average claim value for Construction
Wholesale & Retail Trade, Repairs R&D Claims
Wholesale, retail and trade repairs sectors account for 12% of SME R&D tax credit claims. Average claim value, however, is only 63% of the national average at £35,946. Consumer retail is the focus of this category, which has become increasingly e-commoditised and experiential to improve customer value. This category excludes repair of cars and motorcycles.
What counts as R&D in this sector?
- Developing a bespoke ecommerce platform.
- Creating a fixture management platform to help global retailers manage stock reporting and availability.
- Re-creating existing products using more cost-efficient and eco-friendly materials.
- 6,120 Wholesale & Retail Trade, Repairs R&D Claims
- 52,160 All SME Claims
- £220m Wholesale & Retail Trade, Repairs R&D Claims
- £3bn Value of all SME claims
- £35,948 Average claim value for Wholesale & Retail Trade, Repairs
Transport & Storage R&D Claims
The arrival of digital and smart infrastructure is having a profound effect on transport and storage sector R&D. We are seeing more R&D tax credit claims, but we believe the sector could still do more to realise its full potential. With 415 SME claims worth £20m, the average transport and storage claim (£48,192) is still lower than the average SME benefit. There’s value left on the table here and the technology road map indicates an exciting journey ahead for the sector.
What counts as R&D in this sector?
- Developing software solutions to markedly improve fulfilment efficiency.
- Designing or customising equipment such as conveyor transfer systems for loading freight.
- Designing of developing freight lifting solutions for industrial premises like freight interchanges or storage facilities.
- 415 Transport & Storage R&D Claims
- 52,160 All SME Claims
- £20m Transport & Storage R&D Claims
- £3bn Value of all SME claims
- £48,193 Average claim value for Transport & Storage
Accommodation & Food R&D Claims
R&D tax credits are often claimed in the food sector as new eating styles and trends emerge that see new SMEs born or existing businesses pivot to find solutions for a consumer opportunity. The number claiming R&D tax credits is significant and could be more so, despite sitting in the lower quartile in terms of average claim amounts (£30,769).
What counts as R&D in this sector?
- Creating new chilling methods to speed up production without affecting the texture of the product.
- Adapting recipes to meet sugar regulations whilst maintaining flavour.
- Creating sustainable, eco-friendly living environments.
- 325 Accommodation & Food R&D Claims
- 52,160 All SME Claims
- £10m Accommodation & Food R&D Claims
- £3bn Value of all SME claims
- £30,769 Average claim value for Accommodation & Food
Information & Communication R&D Claims
ICT represents almost a quarter (23%) of SME claims. Computer programming, publishing and telecoms is one of the industries at the forefront of R&D and this year’s stats show it. The average claim value (£63,296) is slightly more than the overall average SME claim (£57,228). The sector brims with R&D opportunities for its 165,000+ SMEs.
What counts as R&D in this sector?
- Developing a new malware detection software.
- Developing a natural language processing technology to understand, interpret and manipulate human language.
- Integration, developing or improving legacy systems.
- 12,165 Information & Communication R&D Claims
- 52,160 All SME Claims
- £770m Information & Communication R&D Claims
- £3bn Value of all SME claims
- £63,296 Average claim value for Information & Communication
FInancial & Insurance R&D Claims
Arguably the blue-chip sector of the UK’s modern economy, financial services and the insurance industry remains robust and innovative. Despite being only a small slice of overall SME claims, the sector’s average claim is significantly higher than the average SME claim (£87,500 compared to £57,228).
What counts as R&D in this sector?
- Inventing new risk management technology for insurance e.g. telematics, sensors and augmented reality.
- Automation of operations and use of blockchain or DLT.
- Integrating open APIs (open banking mandated post PSD II).
- 800 FInancial & Insurance R&D Claims
- 52,160 All SME Claims
- £70m FInancial & Insurance R&D Claims
- £3bn Value of all SME claims
- £87,500 Average claim value for FInancial & Insurance
Real Estate R&D Claims
While there is a healthy commercial property market in the UK, SME R&D tax credit claim volumes (245) tend to sit at the lower end of the spectrum. This is a sector characterised by larger organisations. There are a few specialist SMEs supplying related services such as software and they are increasingly making use of R&D tax credits with a lower average claim value (£40,816) than the overall (£57,288).
What counts as R&D in this sector?
- Developing algorithms to analyse rental value and determine the market value of a property.
- Creating a visualisation tool to help an on-site team to synthesise information into an immersive model.
- Building an online marketplace for a specialist type of housing.
- 245 Real Estate R&D Claims
- 52,160 All SME Claims
- £10m Real Estate R&D Claims
- £3bn Value of all SME claims
- £40,816 Average claim value for Real Estate
Professional, Scientific & Technical R&D Claims
Just over one quarter (26%) of the tax relief claimed via the SME R&D tax-credit incentive goes to companies in this category. More businesses are claiming and claim values are up, too (£77,152).
What counts as R&D in this sector?
- Developing new ways to detect and monitor health conditions.
- Developing new systems to test network security.
- Developing a bespoke ERP system for professional services clients.
- 10,045 Professional, Scientific & Technical R&D Claims
- 52,160 All SME Claims
- £775m Professional, Scientific & Technical R&D Claims
- £3bn Value of all SME claims
- £77,153 Average claim value for Professional, Scientific & Technical
Admin & Support Services R&D Claims
The admin and business support services category encompasses travel agencies, security and investigation activities and general business support services. This diverse cast comprises 6% of the SME claims submitted. These claims are just off the national average, tipping the scales at £51,863 compared to £57,228 overall.
What counts as R&D in this sector?
- Integrating business software with legacy office systems.
- Creating a new piece of brochure production software for the travel sector.
- Developing a bespoke CRM system to manage its business functions.
- 3,085 Admin & Support Services R&D Claims
- 52,160 All SME Claims
- £160m Admin & Support Services R&D Claims
- £3bn Value of all SME claims
- £51,864 Average claim value for Admin & Support Services
Education R&D Claims
EdTech (educational technology) hardware and software is emerging and presenting opportunities for innovation, with the R&D opportunities that brings to this most important of sectors. The average education SME claim (£35,398) is still below that of the overall SME (£57,228) Where before innovation was limited, there is now plenty of potential for R&D projects to unlock new ways of both teaching and learning for students of all ages.
What counts as R&D in this sector?
- Developing a new online platform to facilitate collaborative remote learning.
- Creating a digital portal through which teachers can do their daily admin (attendance, marking, reading assignments).
- Integrating VR and AR to education software to enable better provision for SEN students.
- 565 Education R&D Claims
- 52,160 All SME Claims
- £20m Education R&D Claims
- £3bn Value of all SME claims
- £35,398 Average claim value for Education
Arts, Entertainment & Recreation R&D Claims
More businesses in this sector are claiming than ever before, but like elsewhere average claim value is trending downward (40,000). But as the COVID crisis has forced SMEs in this sector to rethink how we make and consume art, there’s hope this decline will be reversed (or at least arrested) in future.
What counts as R&D in this sector?
- Designing a lighting control system to run both the performance lighting and the house lighting from the show control desk.
- Creating an AV infrastructure that can live stream video and audio across multiple screens.
- Designing an off-the-shelf software for online music distribution.
- 625 Arts, Entertainment & Recreation R&D Claims
- 52,160 All SME Claims
- £25m Arts, Entertainment & Recreation R&D Claims
- £3bn Value of all SME claims
- £40,000 Average claim value for Arts, Entertainment & Recreation
Other services activities R&D Claims
The ‘Other service activities’ category demonstrates the transient nature of business and what counts as qualifying R&D as a result. Other services may include businesses that don’t define themselves as one sector another so rigidly. As a result, it’s rather difficult to predict the constitution and perhaps that’s why this R&D data is low in terms of value of claims. Around 2% of all SME claims align to the other services sector, generating an average claim value of £32,967.
What counts as R&D in this sector?
- 910 Other services activities R&D Claims
- 52,160 All SME Claims
- £30m Other services activities R&D Claims
- £3bn Value of all SME claims
- £32,967 Average claim value for Other services activities
Benchmark your claim against your peers
To ensure you’re receiving the full value on your R&D tax credit claim, speak to our team of chartered tax advisers, sector specialists and former HMRC inspectors.
We can prepare your R&D tax credit claim end-to-end, or if you’re looking for assistance on a specific aspect of a claim you’ve started elsewhere, our tax advisory practice offers flexible, specialist advice adapted to your needs.